Browse guides
Rufio Stats
- Getting started
- People and roles
- Device settings
- Team tracking settings
- Beach doubles (beta)
- Live tracking
- Tracking together
- When the connection drops
- Drafts and merging
- Film review
- Game film
- Recording games
- Stream a game to Facebook
- Stream a game to YouTube
- Tournaments
- Stats and dashboards
- Dashboards
- RufioStats for college & club programs
- The Practice tab
Stats and dashboards
Read the numbers, narrow them to a game or opponent, and arrange the dashboard your way.
The Stats tab
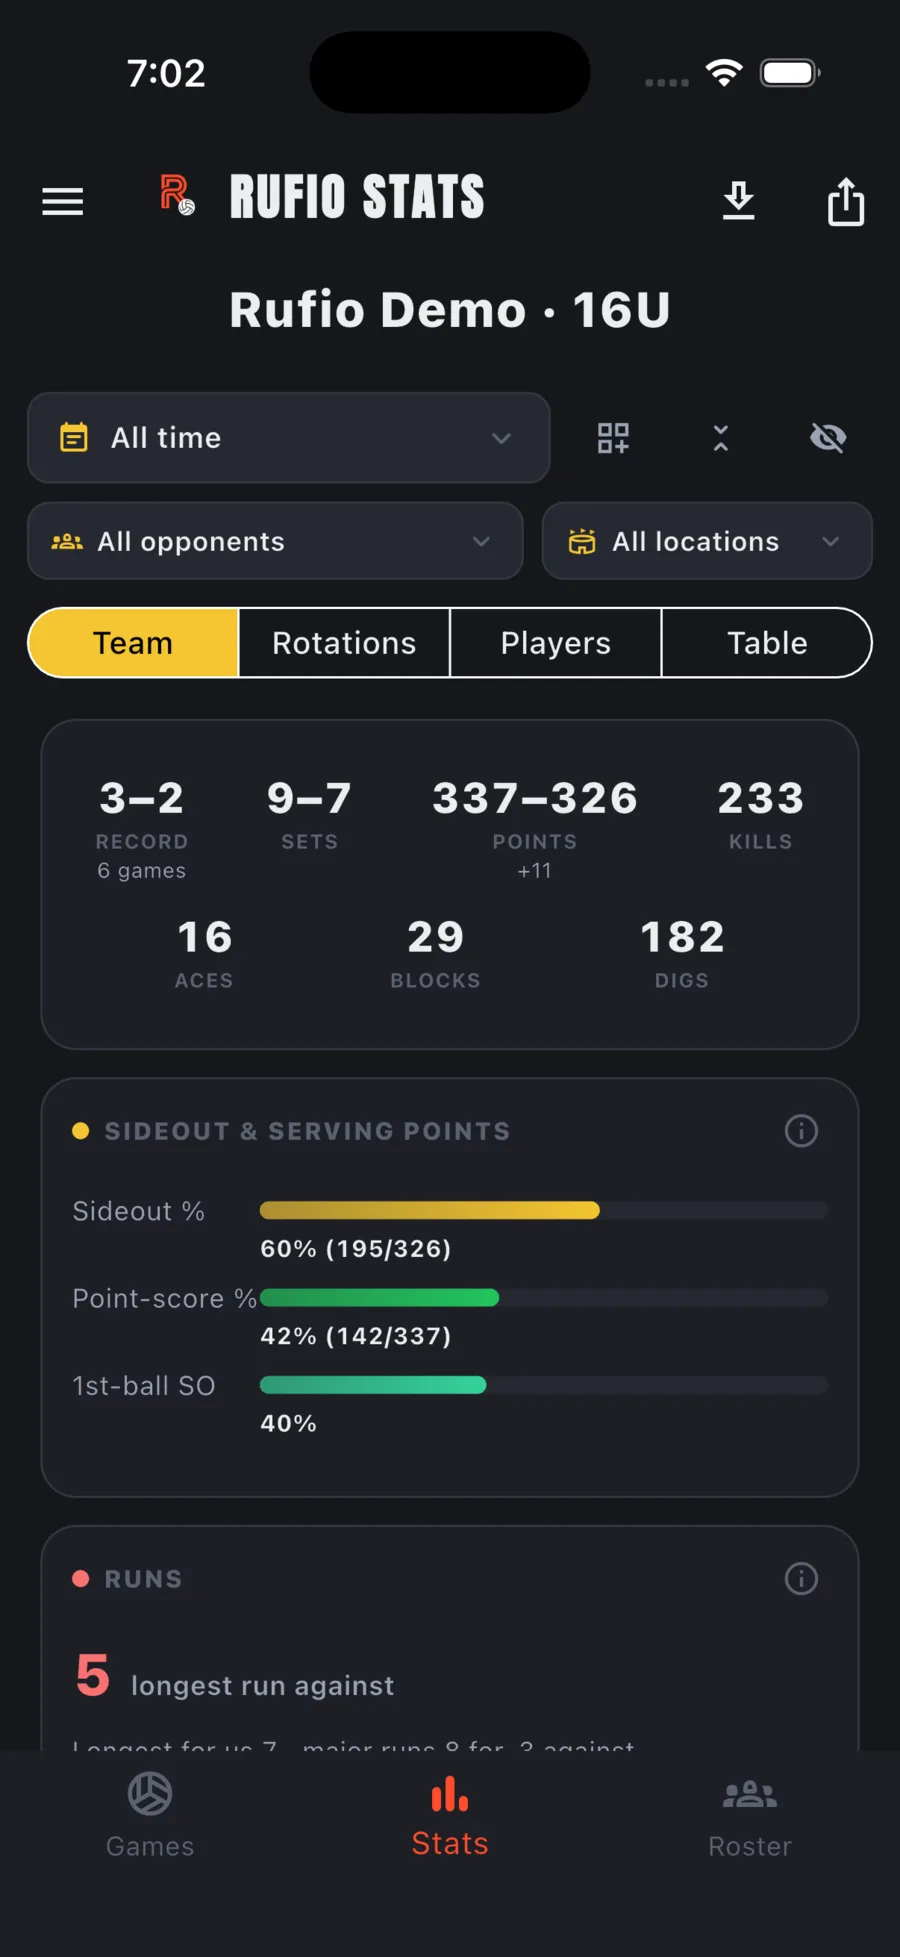
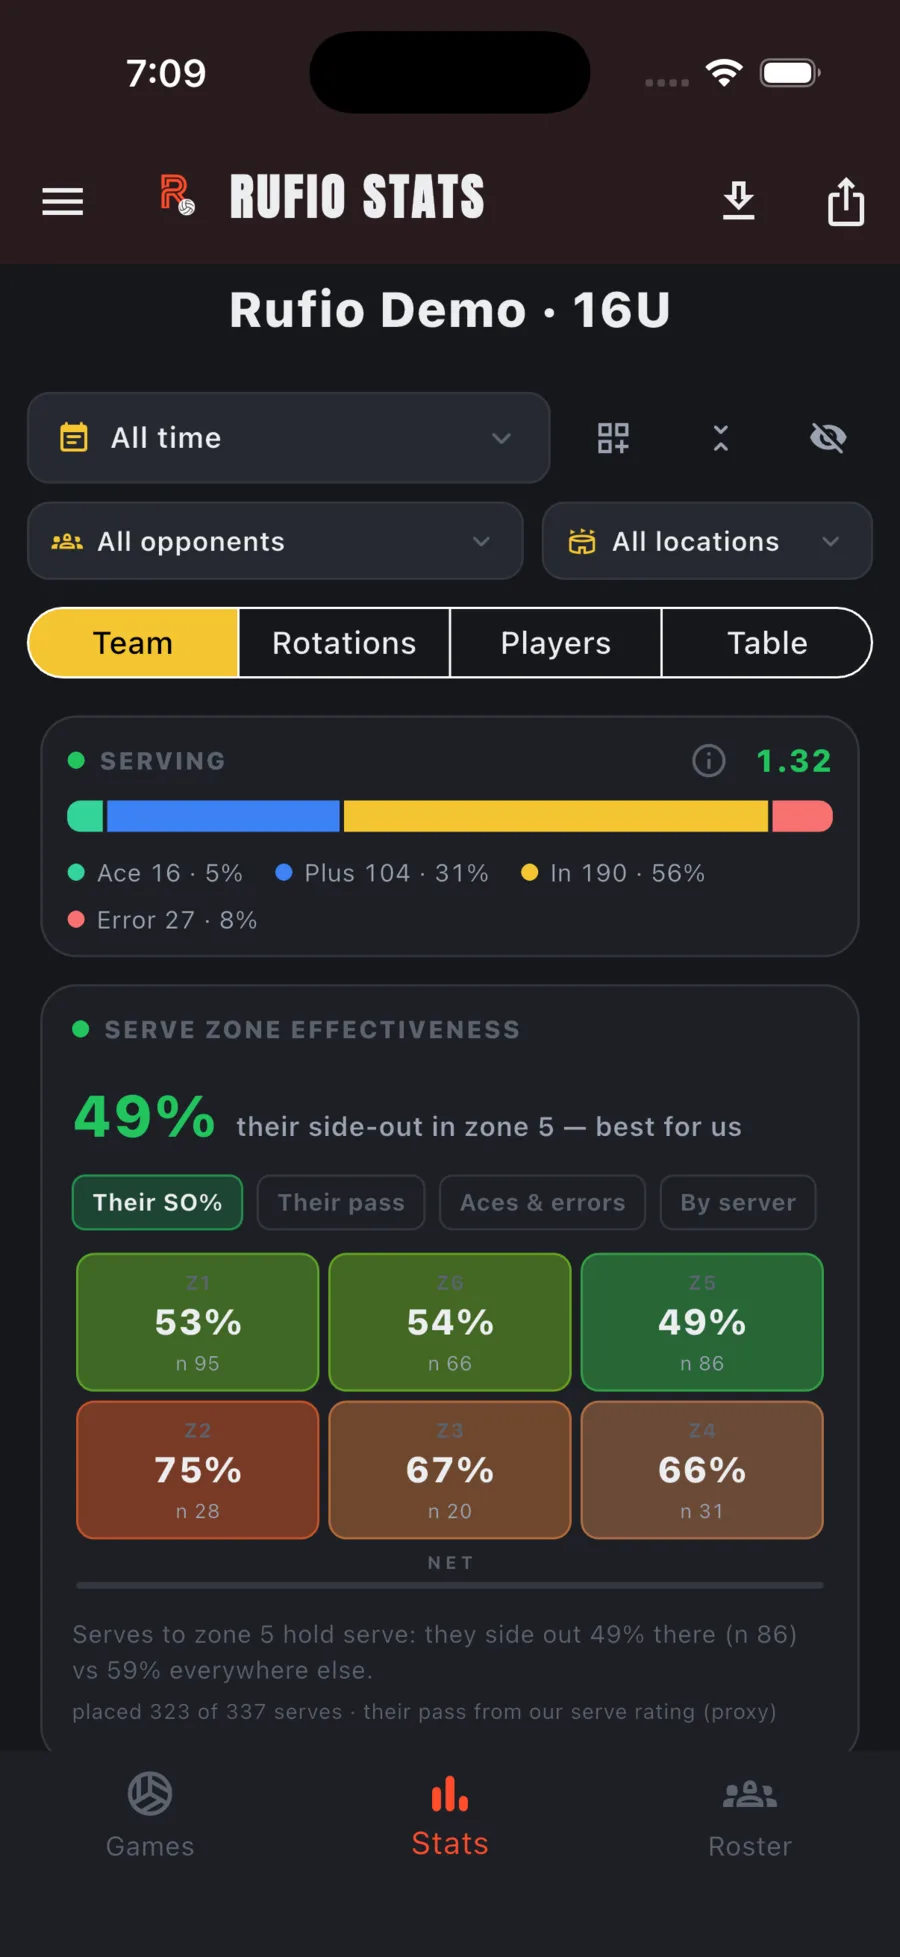
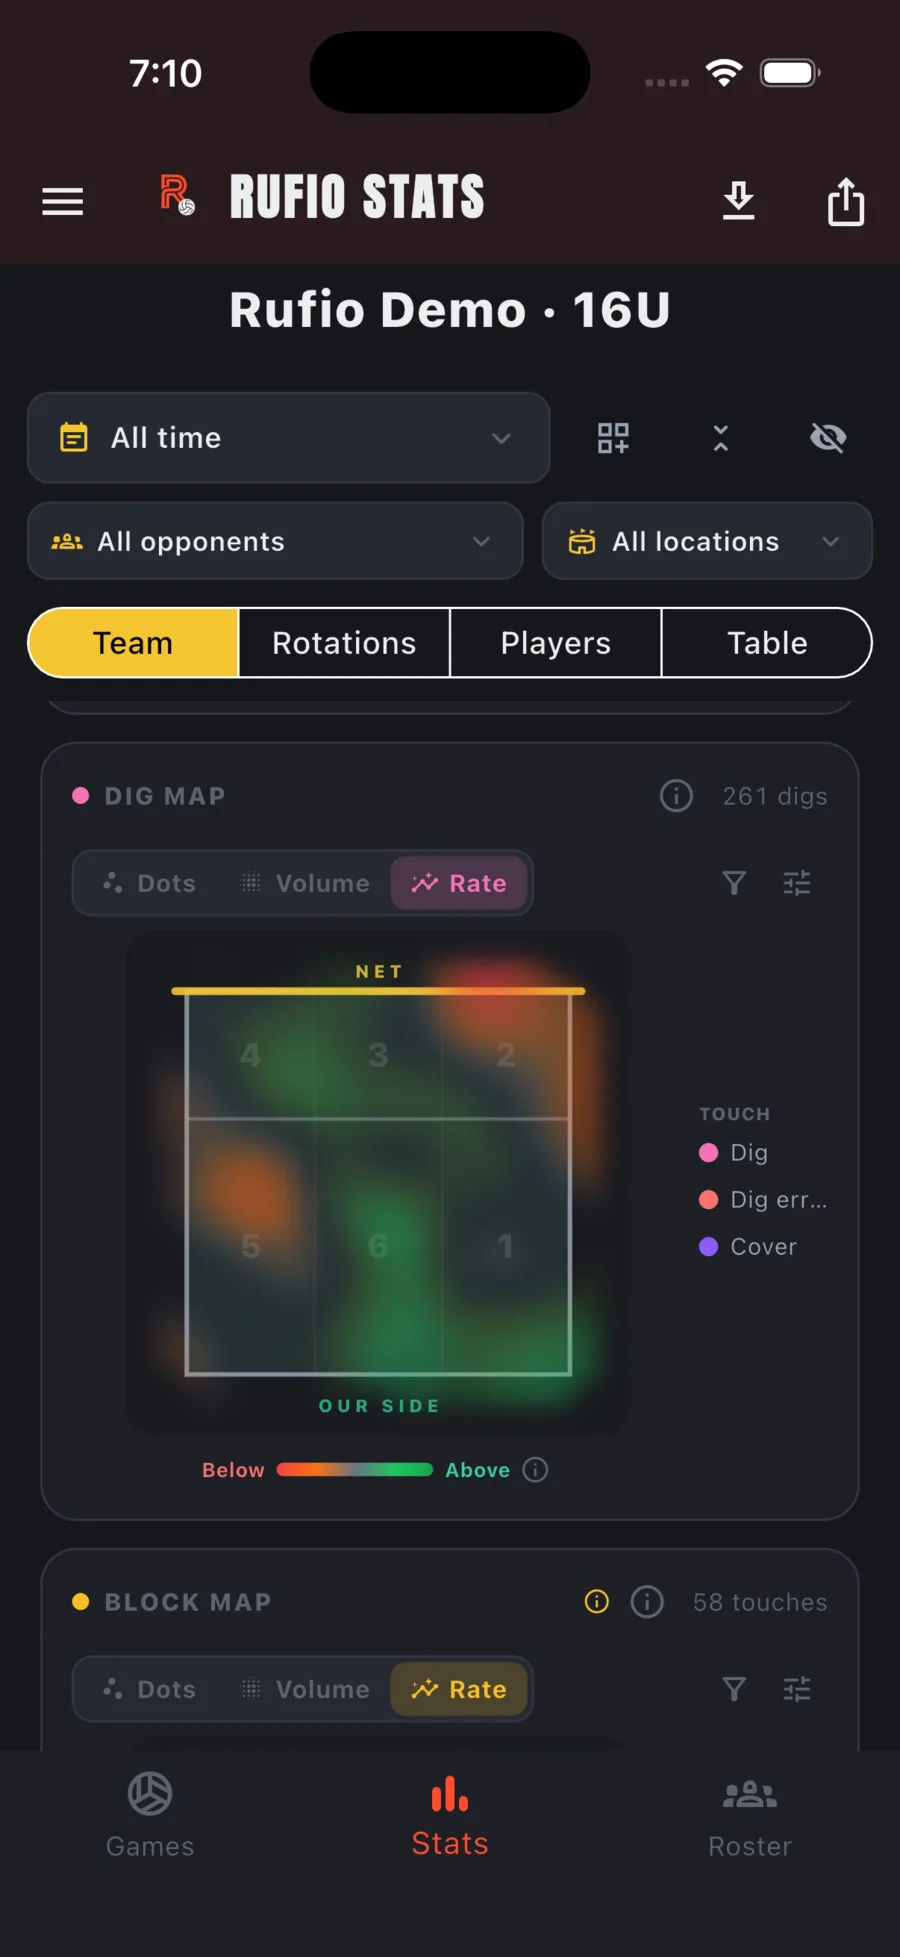
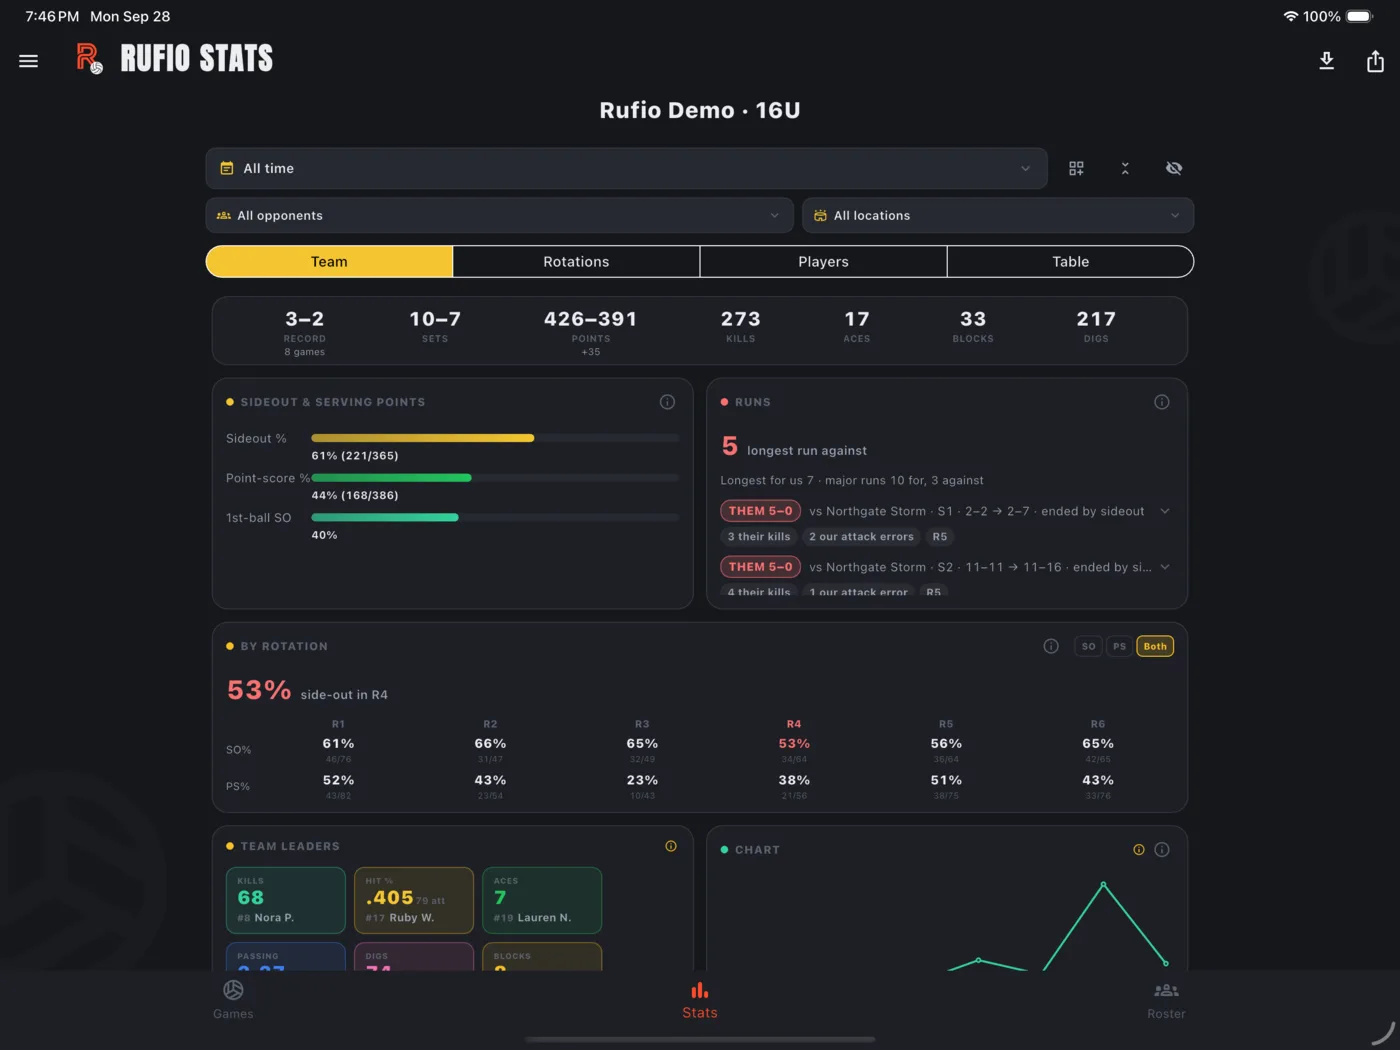
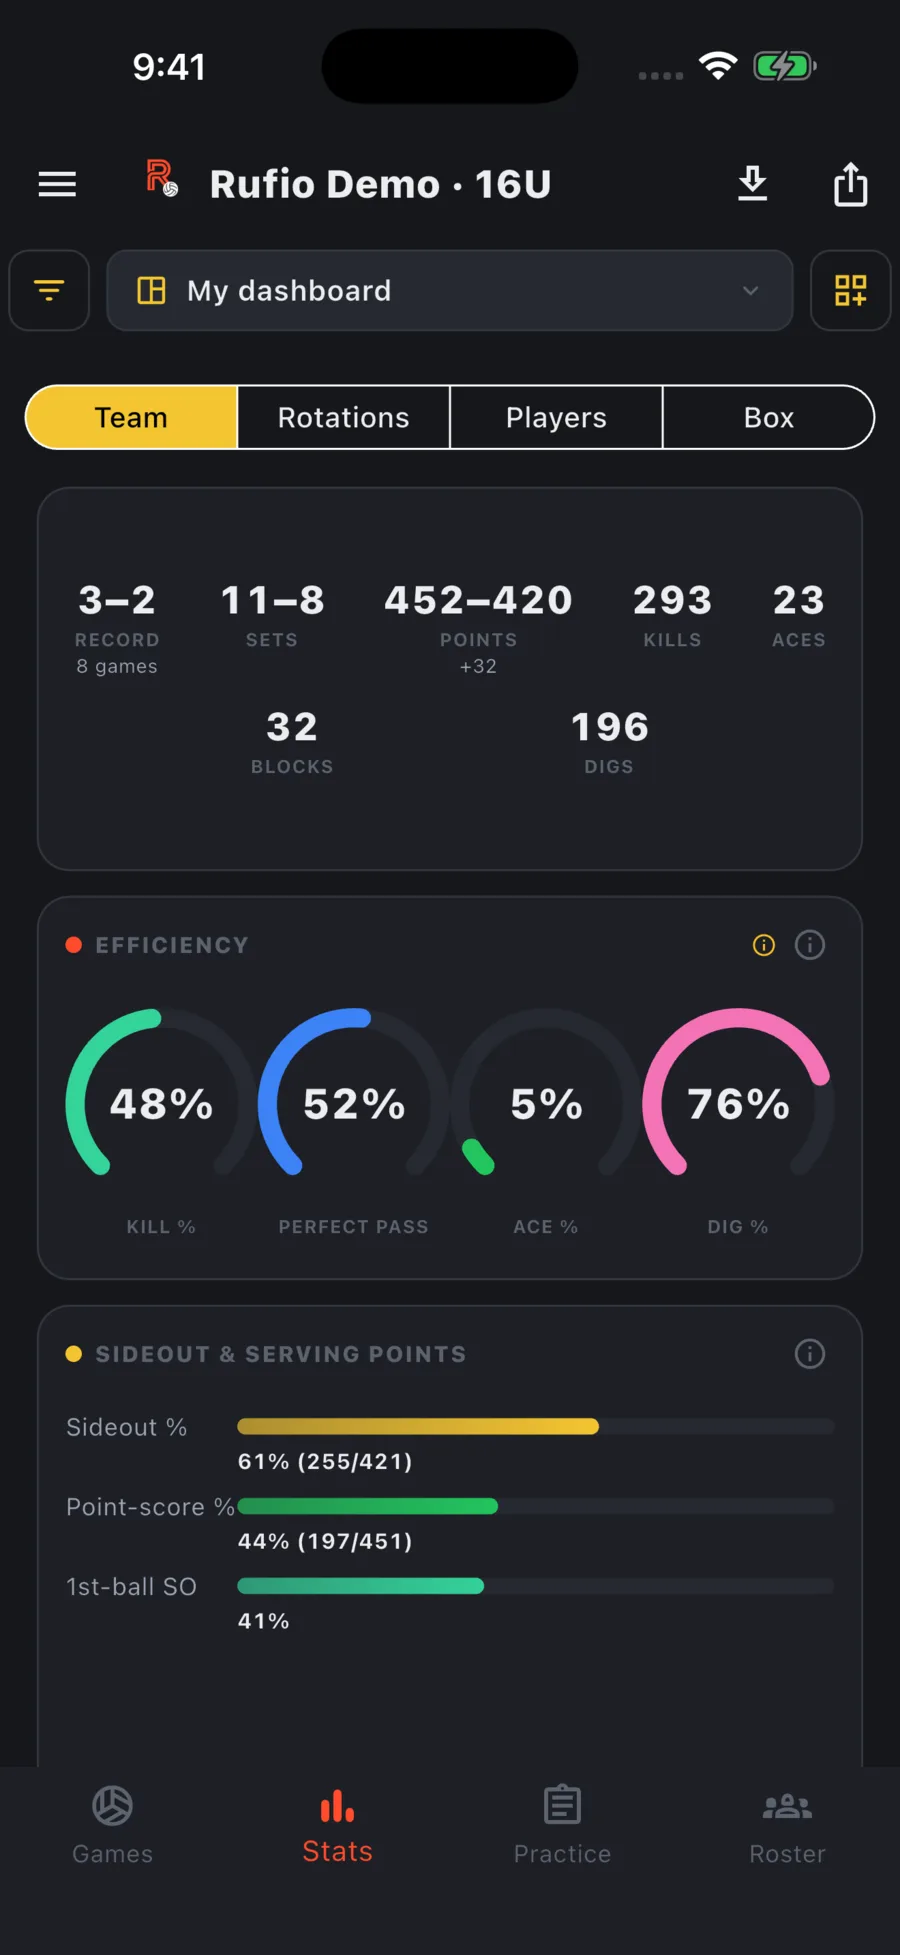
The Stats tab has a filter bar on top and a dashboard of cards below. Four lenses change what the cards are about: Team, Rotations, Players, and Box.
Filters
- Games / Practice: which source the numbers come from. Practice only appears once a practice exists.
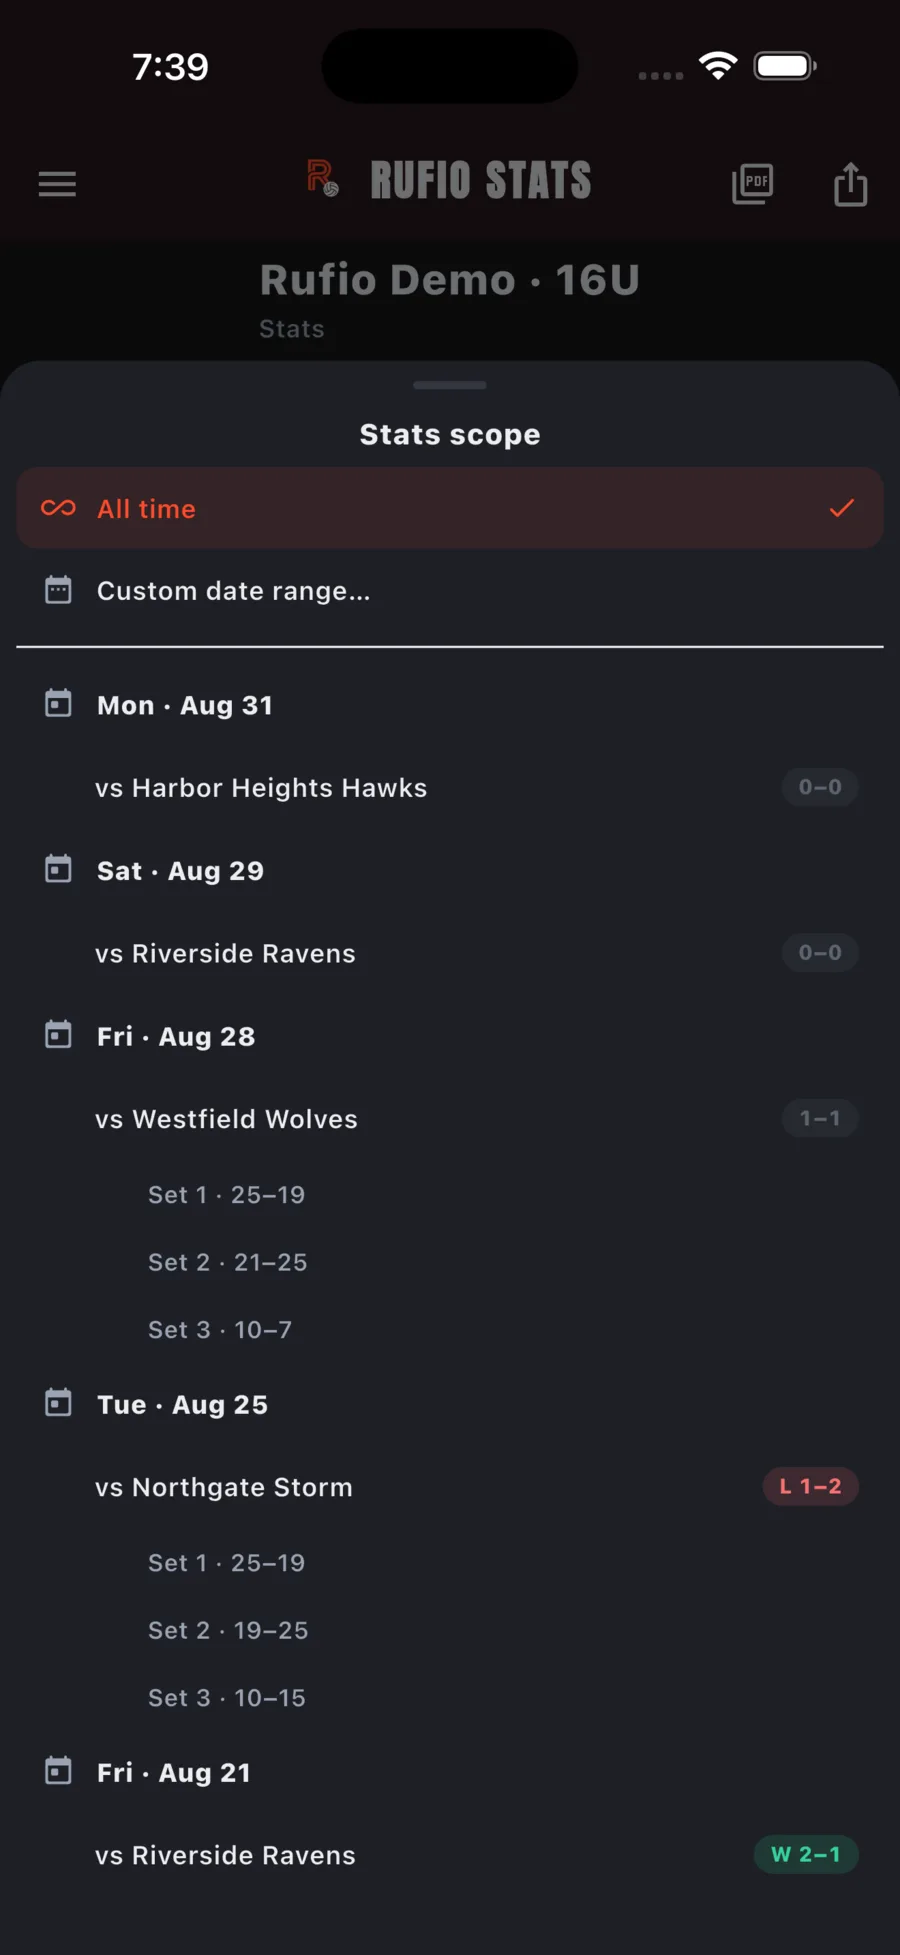
- Filters opens one panel for everything else. It is a dialog on a tablet and a sheet on a phone, changes apply as you tap, Reset puts every filter back, and Done closes it. A small number on the button says how many filters are on. The button sits at the left of the Stats header (an icon on a phone).
- Date range: all seasons, one season, a custom date range, or drill down to a single day, game, or set.
- Opponent: narrow to one opponent, with a search box once you have played more than eight.
- Location: all, home, away, or neutral.
- Include scrimmages: scrimmages are left out unless you turn this on. Only shown when you have any.
- When something is filtered, one line under the tabs says what. Tap it to change the filters, or tap its clear button to remove them all.
Only games with real data count. A match that is still on the schedule, or one that was never tracked, stays out of trend charts, the trend matrix, game logs, record and game counts, and the scouting report's head-to-head list.
The four lenses
| Lens | What it shows |
|---|---|
| Team | Record, sideout and serving points, runs, leaders, a Chart of any metric game by game, by-rotation breakdown, Serve zone effectiveness (their side-out, their pass, aces and errors, or each server, by where your serve landed), Passer x zone, serve receive and attack maps, dig and block maps, set types. From Add widgets: efficiency, shot types, Tempo (attempts, kills, errors and hitting by quick, fast and high), free balls, Overpasses (the ones we swung at and the ones we gave away), After the block & cover (where a blocked attack went next, how often it came back to us, and who covered it), opponent tendencies, Their box score when the other side's players were tracked or imported, head-to-head, Attack directions (each hitting side's swings as line, cross and sharp cones; tap a cone for its numbers and top hitters), Runs (the longest runs against you and what they were made of), Set distribution by system (where your sets go off a good pass and a bad one), Setter tendencies (who the setter goes back to after an error or a kill, the first ball, dumps, and who gets the ball late and close), and Rotation by set. |
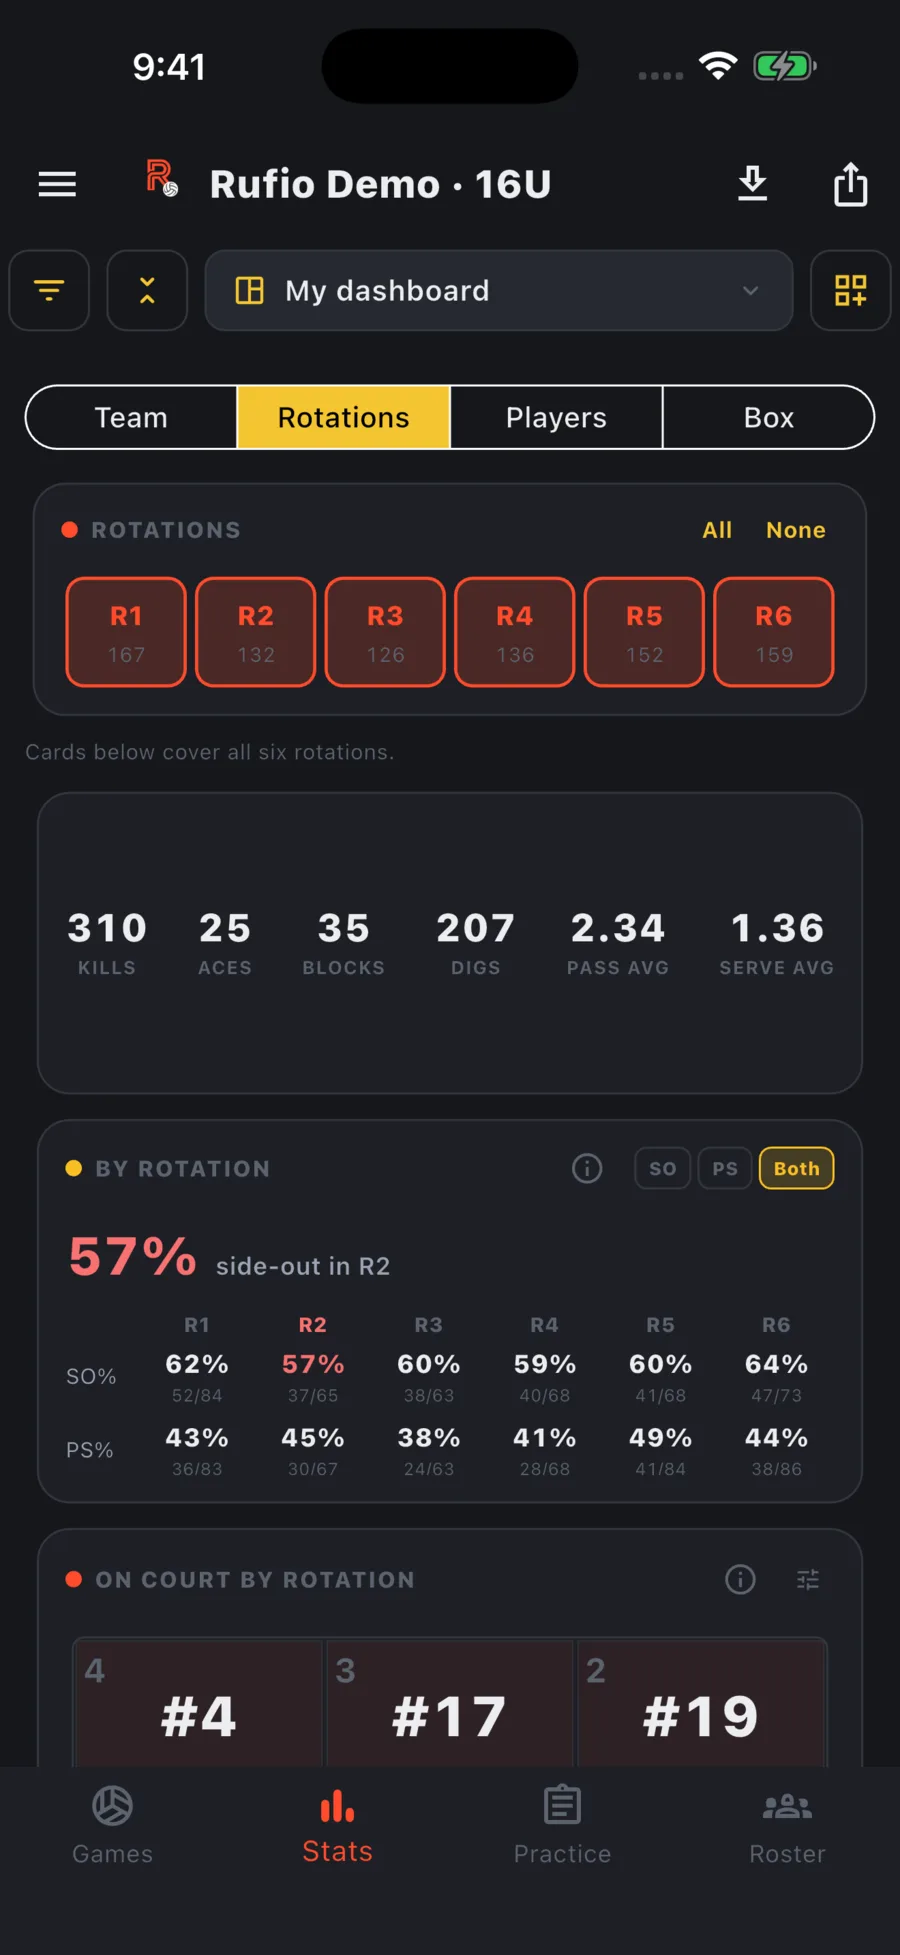
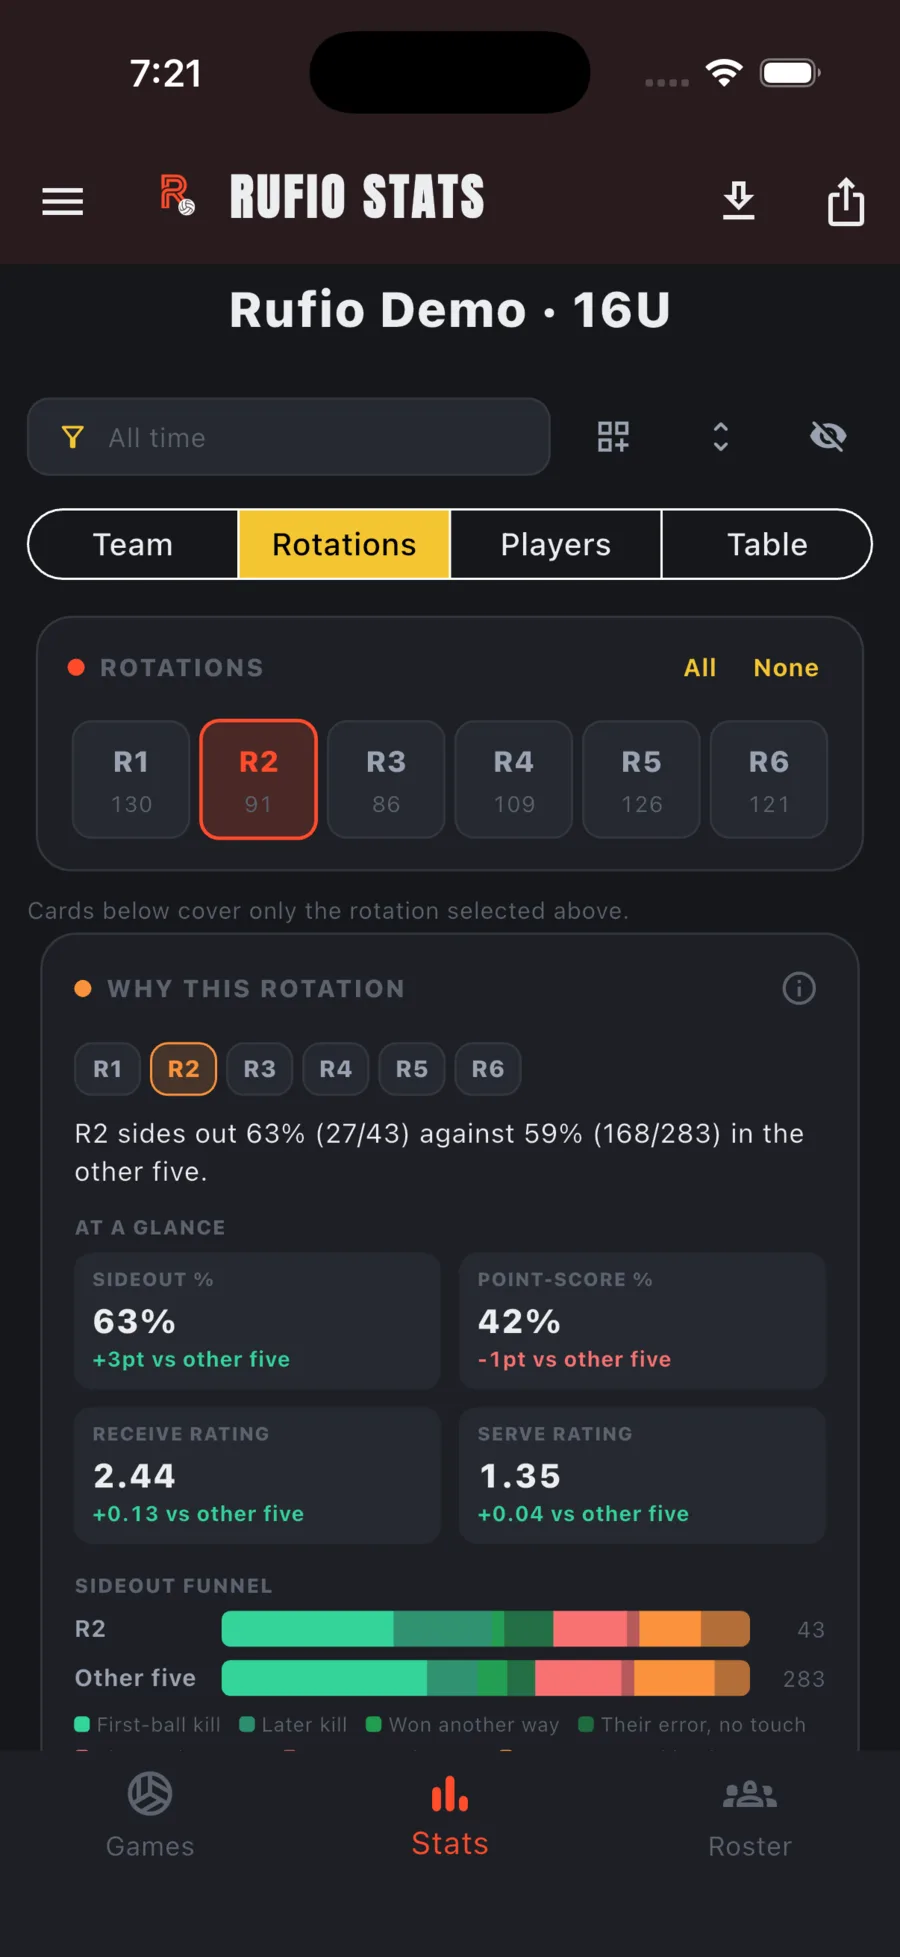
| Rotations | Pick R1 to R6 and see how that rotation performs: a Rotation comparison table (every metric, all six rotations plus Team, including Serve rating and Receive rating on the same 0-3 scale used everywhere else), an On court by rotation map (who stands where, zone by zone; tap a zone for that player's line), and a Why this rotation card that explains your weakest rotation and what it would cost you to track more to sharpen the answer. From Add widgets: a Trend matrix that shows any rotation metric game by game, as a coloured grid or as lines. Needs a starting lineup with a setter. |
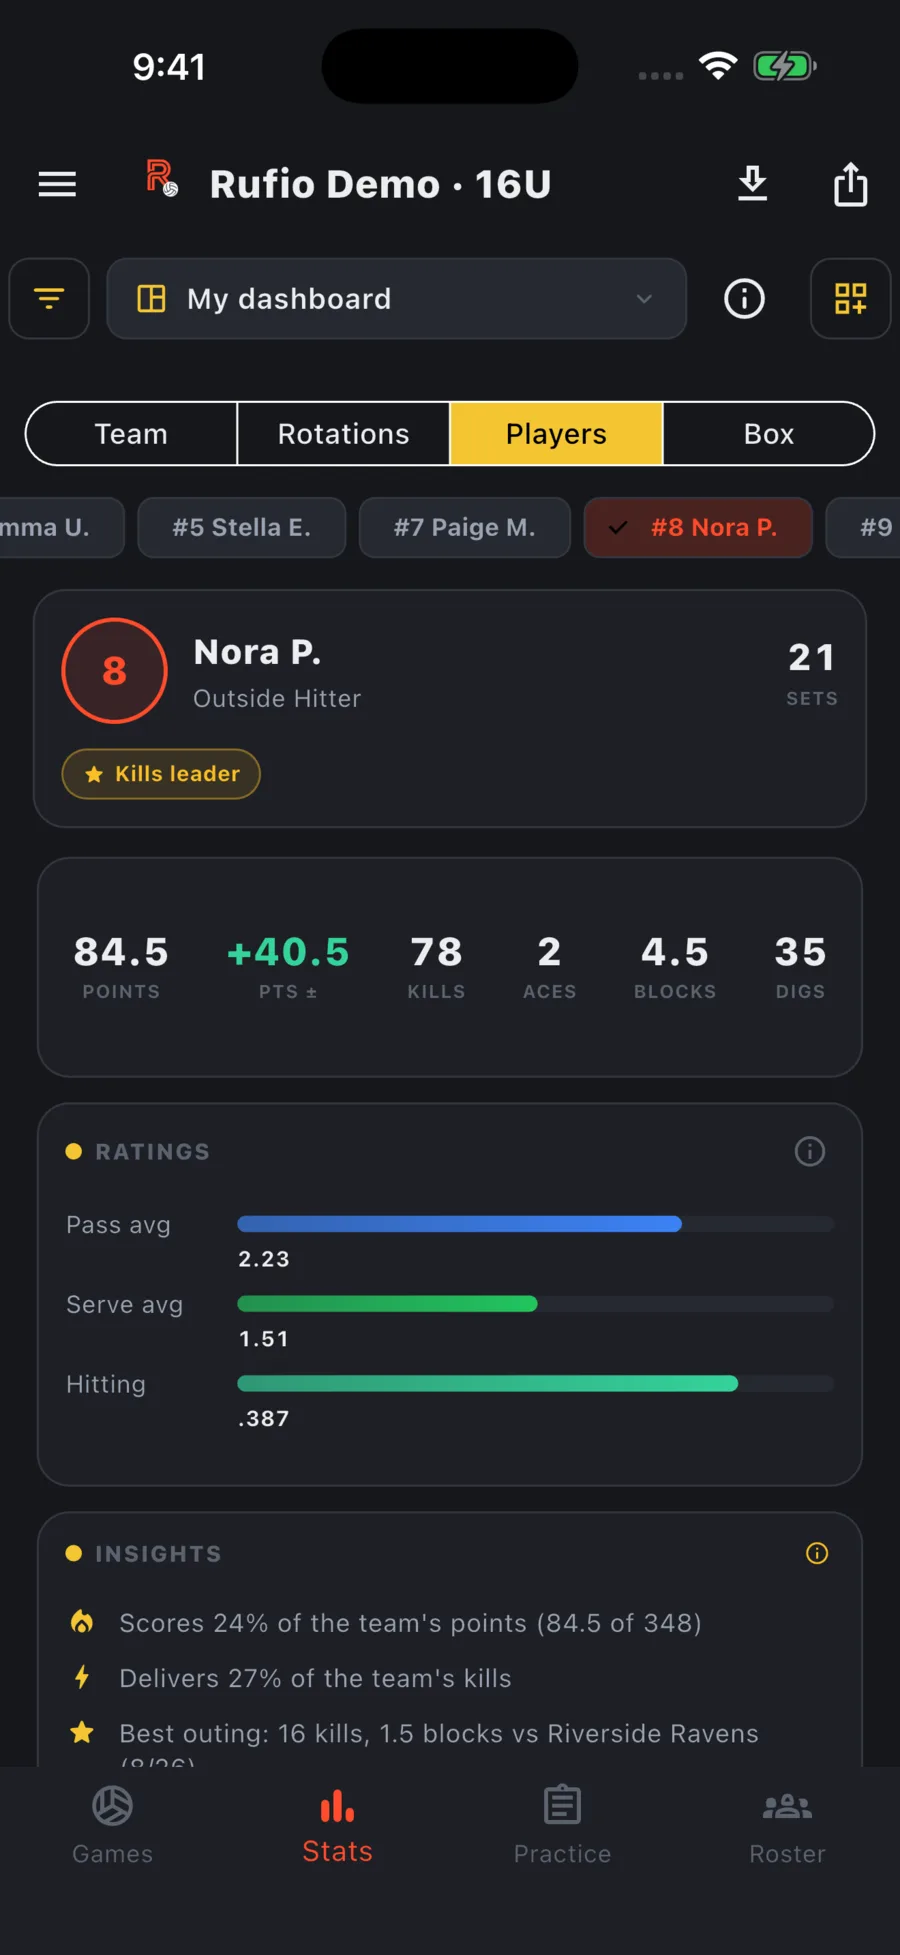
| Players | One page per player: ratings, insights, key rallies, game log. Swipe between players, or tap a name anywhere to jump here. |
| Box | A full box score with per-player rows and team totals: sets with recorded stats, attacks, assists, serving, reception, digs, blocks, ball-handling errors, and scoring points. Player names stay visible while columns scroll. Passing, Serving, Attacking, and Defense tabs keep the detailed ratings and percentages. |
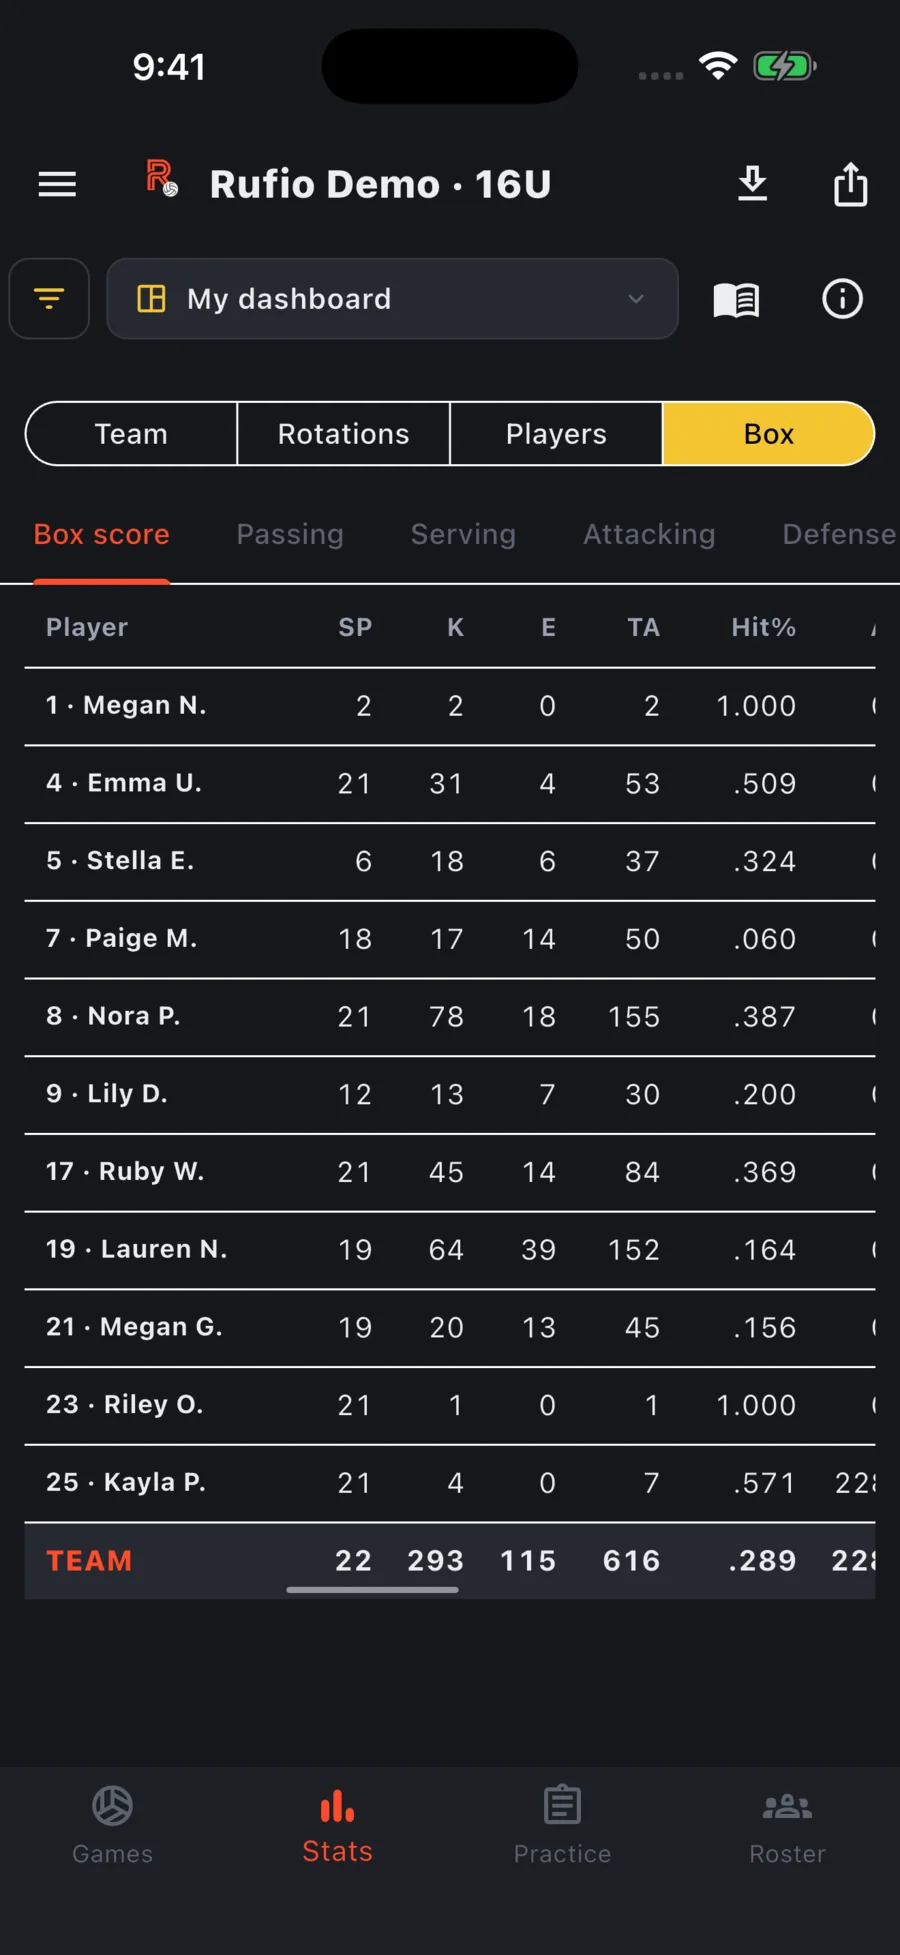
A card that needs something the games in scope never recorded says Not tracked in these games and names the Team settings switch that would start recording it, instead of quietly disappearing.
A team-only game (tracked with Team stats only on) shows a note on the Players and Box lenses and has no per-player rows to show, but its team totals, shot maps, and rally stats are complete.
On the Rotations lens, Hide rotations folds the R1 to R6 picker away to make room for the cards.
Earned sideout, expected and match flow
A few numbers look past the raw sideout and point-score to how the points were really won. Tap the ⓘ on any of these cards for the same explanation.
- Earned sideout % (on Sideout & serving points): sideout with the other team's missed serves taken out. A serve into the net gives you the point without a pass, so it is left out of both sides of the sum.
- Earned point-score % (same card): point-score with your own aces and serve errors taken out. It is how often you win the rally once the ball is actually in play.
- +/- (on Rotation breakdown): points won minus points lost while you were in that rotation, serving and receiving together.
- Won after our block touch (on After the block & cover): rallies where your block got a hand on their attack without stuffing it, and how many of those you went on to win.
- Expected vs actual: every reception is priced by its pass grade, using what that grade usually wins for your team this season, and every serve by its serve grade. Expected is the average of those prices; actual is what really happened on the same rallies. A gap above zero means you won more than your passing and serving predicted. The card also lists each passer.
- Offense by pass: what the first attack does after a 3, a 2 and a 1 pass. Kill %, hitting efficiency (kills minus errors over swings, blocked swings counted as errors) and how often you sided out.
- Transition: after each of your digs, how often you got a swing, how often that swing was a kill, and how often you won the rally. Split by dig grade when you grade digs.
- Points earned vs given: points you won with your own aces, kills and blocks against points you gave away on errors (serve, attack, ball handling, reception and block), each per 100 rallies, plus how often a sideout or a serve point finished on your own play.
Arranging the dashboard
- Tap Edit (an icon on a phone) at the right of the Stats header.
- Drag a card by its handle to move it anywhere, gaps included. Drag the corner knob to resize. Double-tap the knob to reset the size.
- Rename… in a card's options gives that one card its own title. The Add widgets list keeps the widget's own name.
- Tap the eye to hide a card, or Add widgets to turn cards on and off from the full list. Some cards can be added more than once with different settings.
- Tap Done. Reset layout in the options menu puts everything back.
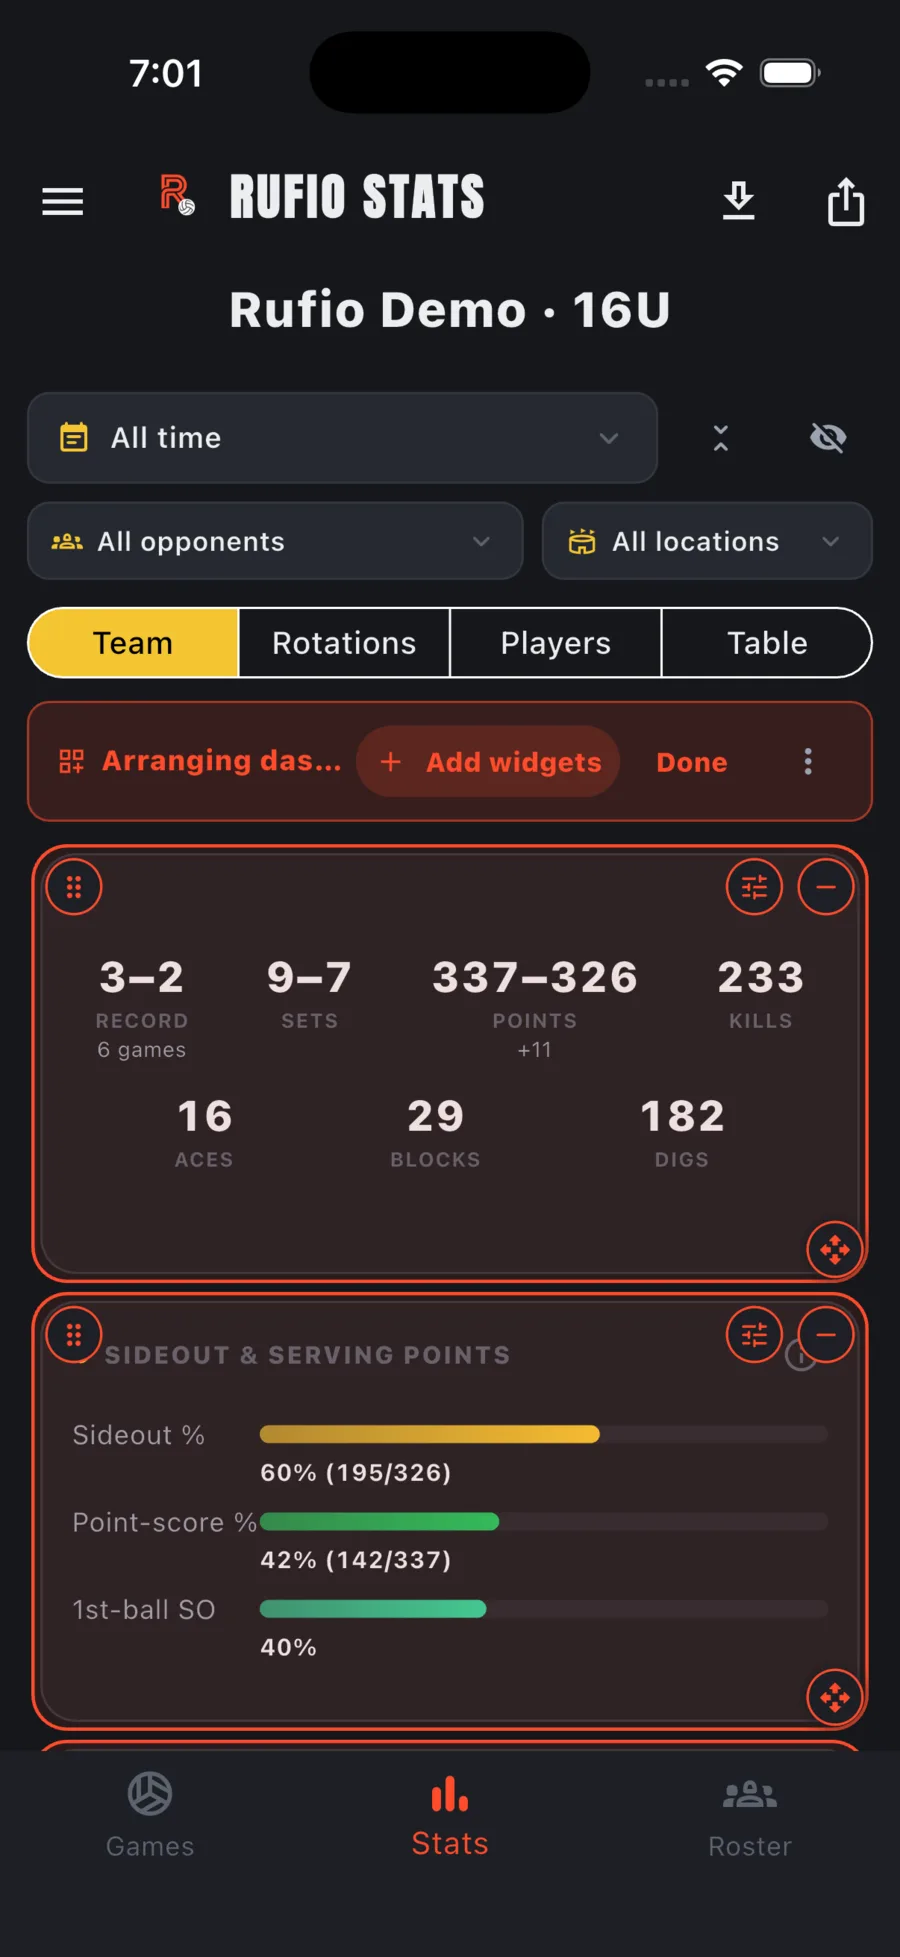
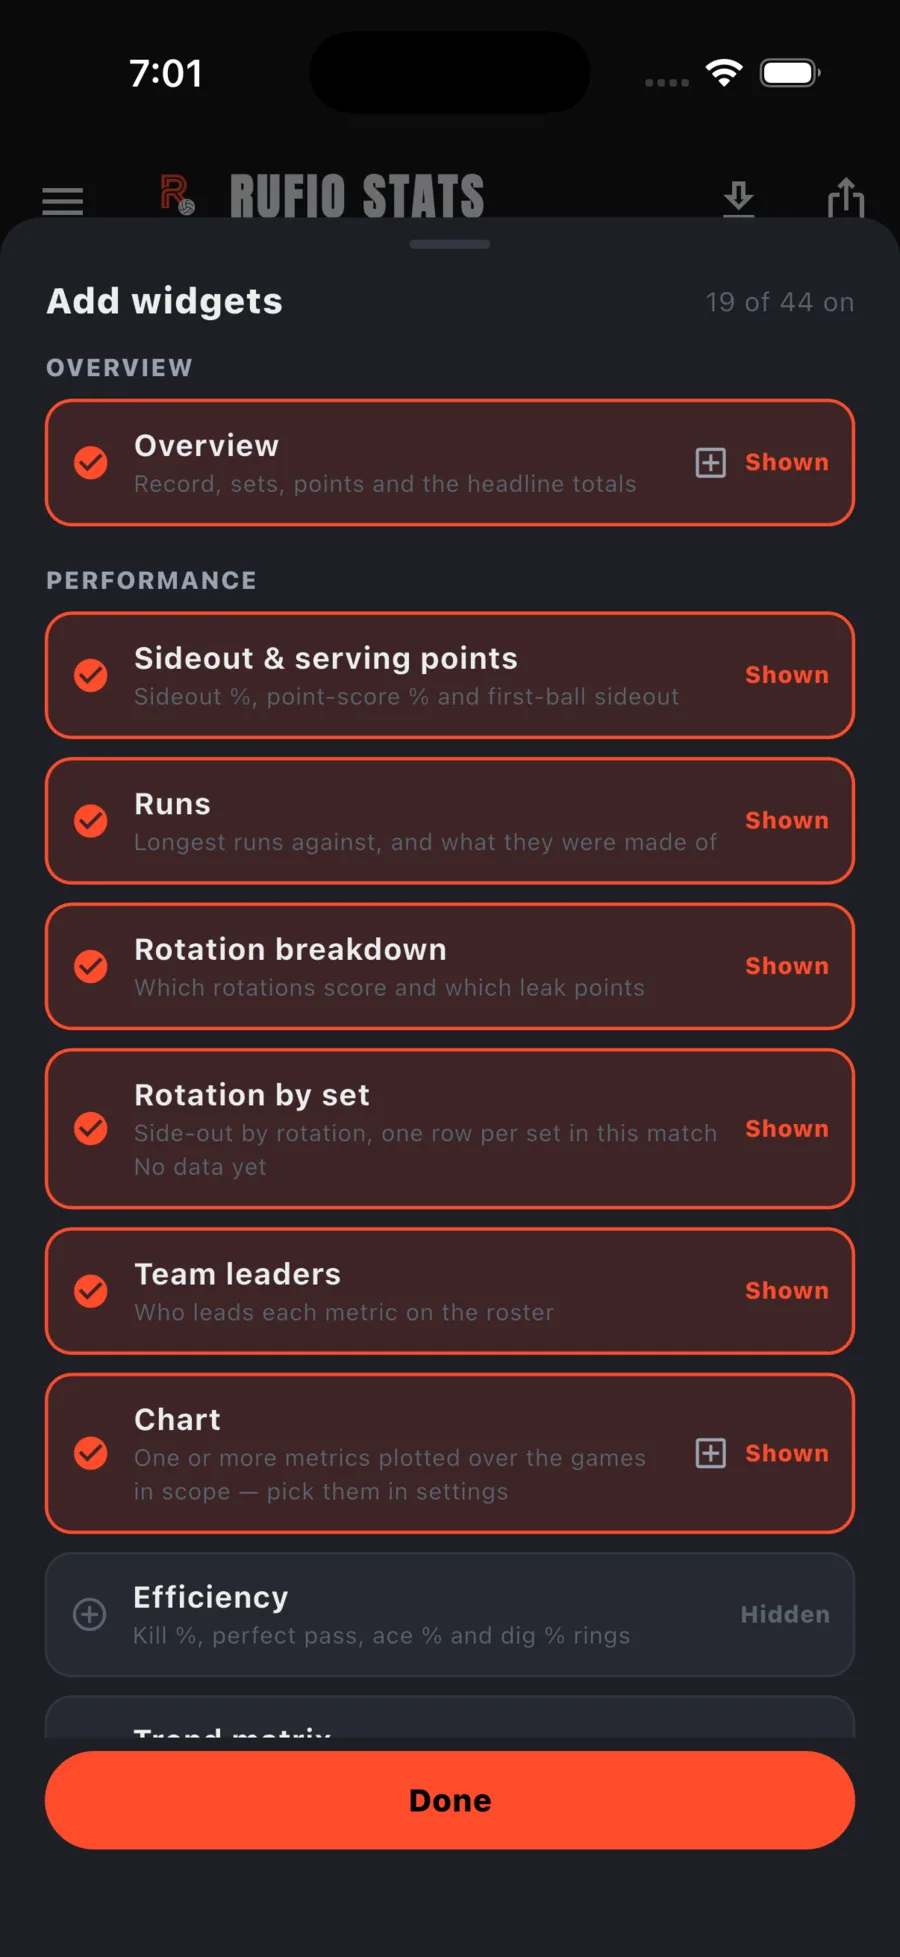
Your arrangement is saved to your account as a named dashboard and follows you to every device you sign in on. Phones and tablets still keep their own layout, since the cards that fit each are different. Every card also remembers the view you last picked on it (a lens, a toggle, an expanded row) between visits. Tap the ⓘ in a card's title for what it shows and how to read it. On charts and the trend matrix, tap a legend entry or a row to hide it. See Dashboards for naming, switching, publishing to your team, and sharing a layout.
Team leaders is one of the cards with its own settings (tap its gear in edit mode): pick which stats it shows, grouped Scoring, Efficiency and Volume, reorder them, and switch any count stat (Kills, Aces, Blocks, Digs, Assists, Points) between a total and a per-set average. Choose to show just the leader, the leader plus the next closest, or the top 3. A tie shows a T next to the value and how many are tied; tap it for the names. The card sizes itself to fit exactly what it is showing: it fills a resized card instead of leaving a gap, and if a card is too short for everyone, it hides the fewest tiles it can and adds a tappable "+N more" for the rest. Add the card again for a second leaders board with a different pick, like "Offense leaders" and "Defense leaders" side by side.
Stats elsewhere
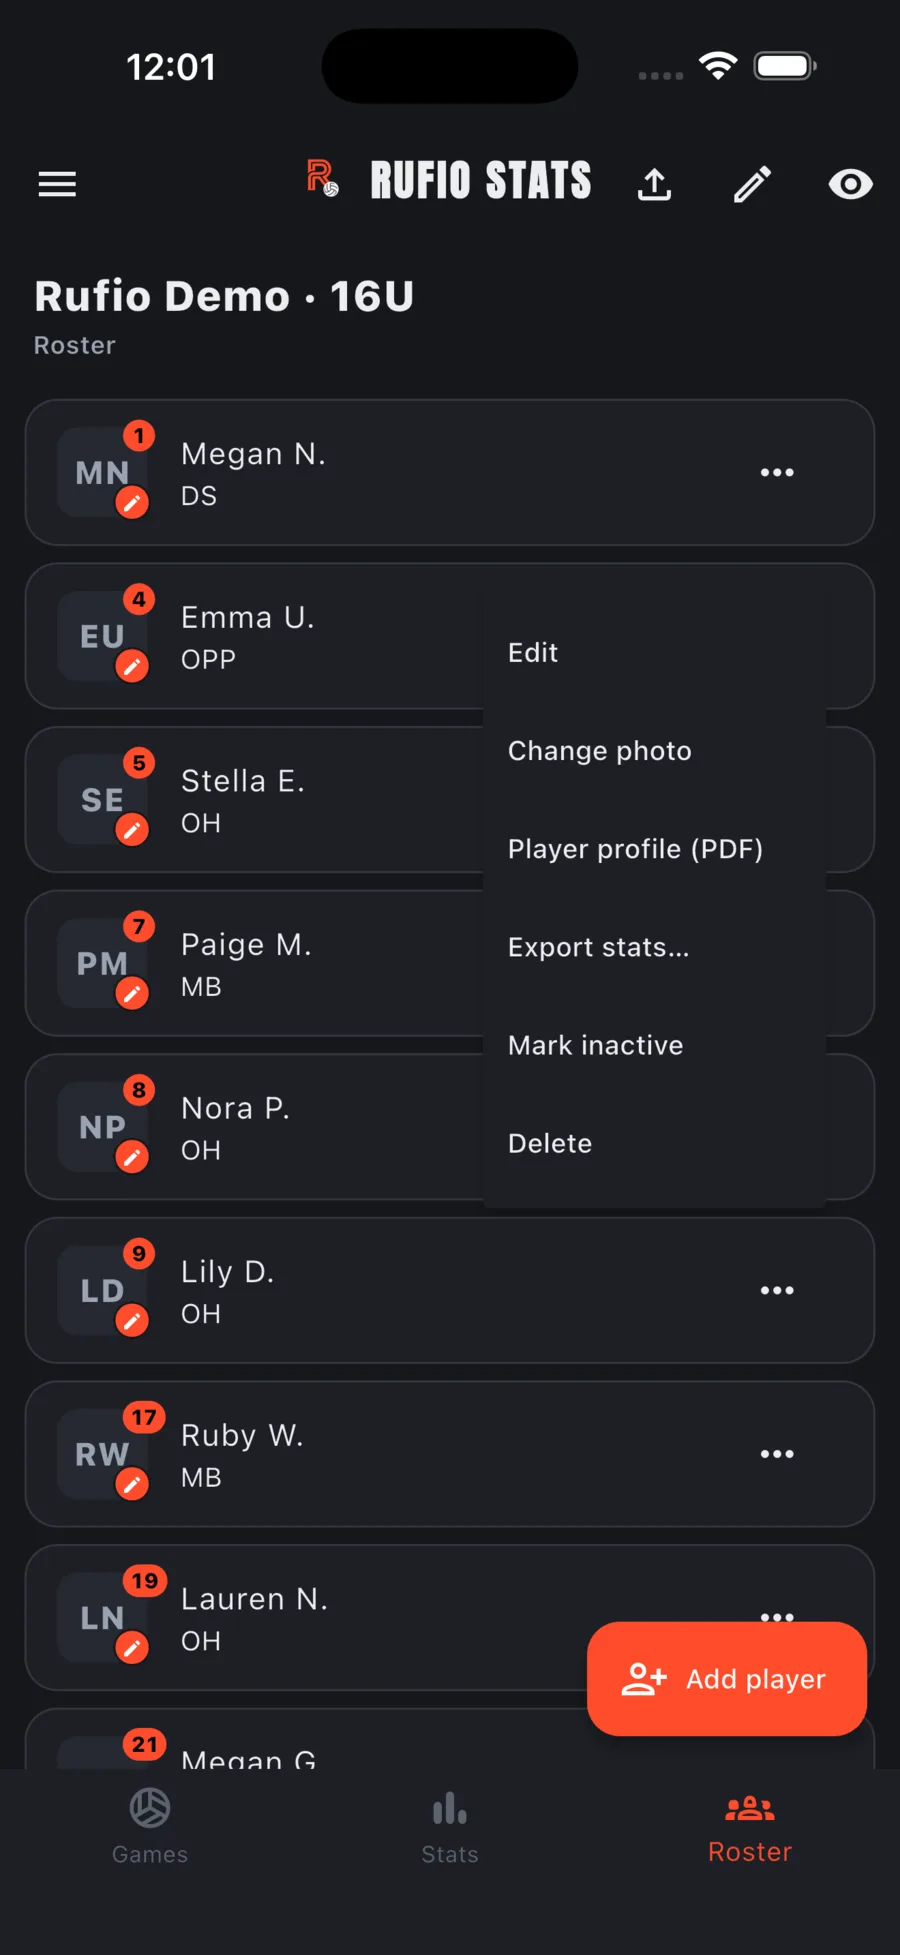
- Roster tab: tap a player to edit their details; the ⋯ menu on each row has Player profile (PDF) and Export stats…. Tapping a player name anywhere in Stats opens their page in the Players lens.
- My stats (menu): your own career stats if you hold a player account, merged across teams.
- An organization's Overview tab: point differential, games by week, standings, top performers, and leaders across every team in the club.
- Public team page: what followers and the public see, at the level set under Stat visibility. Share it from the Games tab's ⋯ menu (Share team stats link), which now also offers Link to stats. Visitors can try Customize there too; see Dashboards.
Exporting
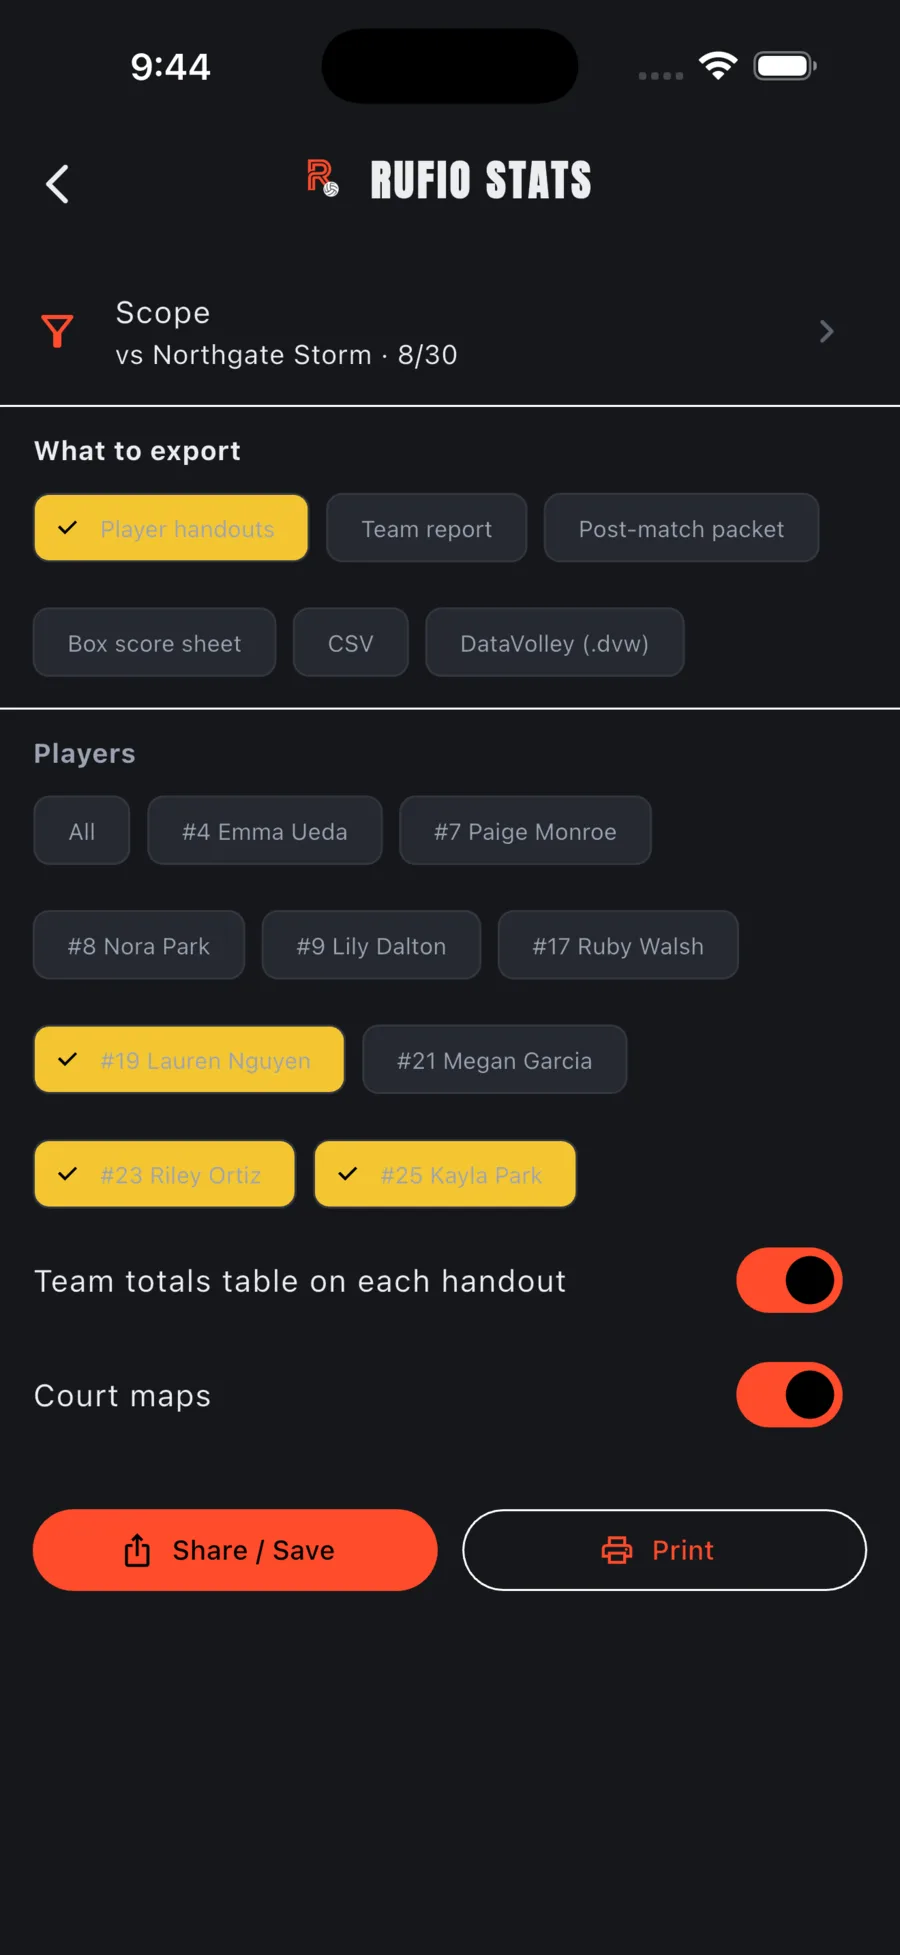
Exports live in the Export Center. Open it from the Export icon at the top of the Stats tab, or from Export on a completed game's ⋯ menu, which opens it already scoped to that game. Every PDF can be printed straight from the sheet or shared as a file, and every CSV opens in a spreadsheet. Files share one naming pattern, so a folder of them stays sorted.
- Pick the Scope: a career, a season, a date range, a day, one game, or one set. Pick a single game or set and the sheets log it set by set instead of game by game.
- Pick a recipe under What to export: Player handouts, Team report, Post-match packet, Box score sheet, CSV, or DataVolley (.dvw) for one game.
- For handouts, pick Players (all, or a few). Options underneath: Team totals table on each handout, Court maps, and Rotation breakdown.
- Tap Print or Share / Save.
| Recipe | What it prints |
|---|---|
| Player handouts | One sheet per player: a strengths and work-on box (This week on a match, Focus over a season, each line quoting the player's numbers and the team's), the Per skill row with a bar showing the player against the team, game log, trend lines, shot mix, attack zones, and the tendencies grid. Nothing is printed on fewer than five attempts. |
| Team report | A match report or a season report: top numbers with headlines (best and worst sideout rotation, top hitter, passer and server), the By rotation table with sideout and point-score shading, court maps with ball paths and a key, and the tendencies grid with hitting efficiency under each share. |
| Post-match packet | The team report and every player's handout for one match, in one file. |
| Box score sheet | For one game, the match stat sheet with a by-set breakdown. For a wider scope, the season sheet. |
| CSV | Season totals (one row per player), per game, per set, or the box score, for a spreadsheet. |
| DataVolley (.dvw), beta | One indoor game as a DataVolley scout file: rosters, lineups, every set's rallies with the touches you tracked, and court zones and coordinates where you tapped them. |
- One player from the roster: Export stats… on the Roster tab's ⋯ menu gives the Player stat sheet as a PDF or CSV with the same scope picker. Player profile (PDF) is the older one-page profile and is still there.
- Your own: if you have claimed your roster spot, Export my stat sheet on your profile exports your sheet per team. A team that only shares scores with its players is left out, with a note saying why.
- Everything: Export JSON and Export CSV under Device settings.
Exporting to DataVolley
Pick one game in the Export Center, choose DataVolley (.dvw), then Share / Save. The file opens in DataVolley and in tools that read its format, so a staff that already works in .dvw files can take your match straight into their workflow.
- The file holds what you tracked. Touches you did not record, often most of the opponent's, are not invented, so a DataVolley validator will note serves with no reception and rallies with no ending touch. That is expected for a partial scout.
- Opponent players you did not name appear as Opponent 1 to Opponent 6.
- Beach games and practices can't be exported to .dvw; the format is six-a-side matches.
- This is a beta. We check every change against the openvolley and dvalidate validators. If a file doesn't open where you need it, tell us with Send feedback in the app.
Importing DataVolley files
A DataVolley scout file (.dvw) becomes a normal game. On the Games tab, open the ⋯ menu and tap Import DataVolley file…, pick the file, and it lands on the schedule with rallies, box scores, lineups, and the opponent's roster. Import into a team for a match you played, or into scouting for a match you watched.
To bring in a whole league, tap + in the menu, choose Set up something new, then Import a league from DataVolley files…. Select every file for the season and the app makes an organization with one team per club, filing each match under both clubs. Cards that need something the files did not carry, such as court locations, say Not tracked in these games.
Scouting reports
A completed game's ⋯ menu has Scouting report, which opens what you have on that opponent across every meeting. From there you can export it as a PDF or a CSV, for the whole team or one of their players.
- Box score, shot mix, rotation tendencies, serve targets, and pass quality.
- Every percentage shows the sample size behind it. Any rate built on fewer than five plays is marked, so a thin number does not read as a tendency.
- Starting lineups prints their opening six by name and jersey number, position by position, for every six you saw them start a set in. Turn it off in the export sheet to print rotations only.